Track Core Web Vitals on your website over time. See how real users experience your website and how many people are having a poor experience.
Google's web vitals impacts SEO. DebugBear tracks the Core Web Vitals metrics across your entire website and helps you fix the issues you see in Search Console.
Identify slow pages that need to be optimized and page elements that are responsible for poor performance.
Analyze all visitor experience to find out when page speed issues around and what's responsible for them.
Understand what lead up to a slow experience and where exactly it happened. See details on visitor device, location, network speed, and more.
Use the Optimize tab to narrow down the data you need to look at to improve each Core Web Vitals metrics.
See what UI elements are most often responsible for poor INP scores.
Understand what happened before a slow interaction, when it happened, and what code slowed it down.
Check if background tasks during the initial page load slow down user interactions, if complex interactions require a lot of processing, or if rendering UI updates takes a long time.
See how often different page elements are responsible for the Largest Contentful Paint and track how long they take to show up.
Use a request waterfall to see what resources are needed to show the LCP element and how long they take to load.
Break the LCP metric down into subparts to pin down where you need to optimize.
DebugBear uses the Long Animation Frames browser API to report what JavaScript tasks take a long time to run.
See how often different scripts are responsible for slow user interactions. Review individual page views to see when what code delayed the next paint.
See how page speed impacts bounce rate and user engagement.
Segment page views on your website based on custom tags and monitor custom metrics that matter to your business.
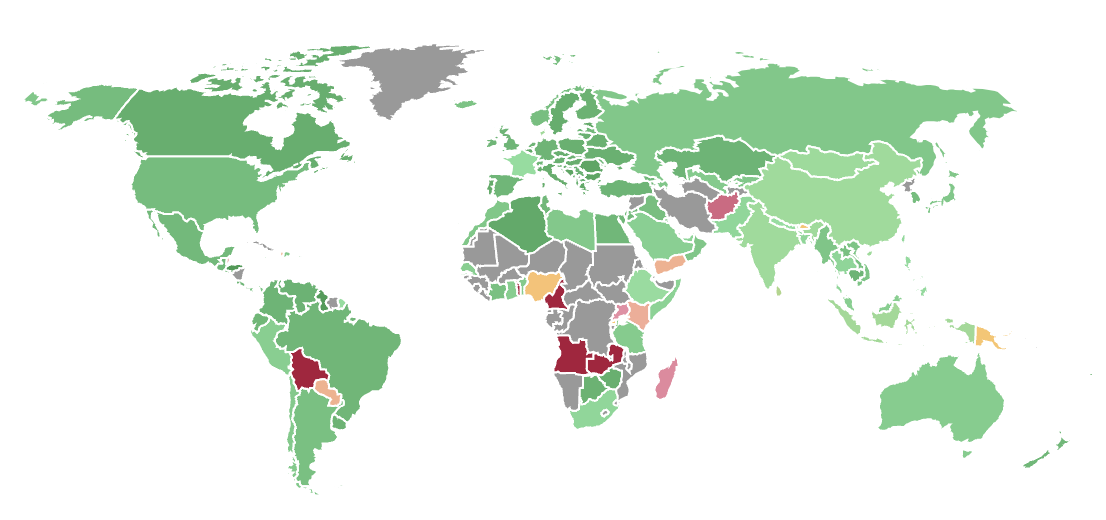
Users who are closer to your website servers spend less time waiting for your site to load. Visitors in some countries have faster devices and networks than others.
See how Time to First Byte (TTFB) and First Contentful Paint (FCP) are holding back your site. Check traditional metrics like Load Time for extra insight.
Is LCP slow because images take a long time to load? Is TTFB poor because of slow connection times? DebugBear tracks metric subparts and provides dedicated dashboards for them.
Monitor network RTT and bandwidth of visitor connection and break data down by device or location.
Get a detailed report for each page visit to understand how the page loaded, investigate interaction performance, and identify the cause of layout shift.
Use device details and estimated network speed to understand, replicate, and optimize slow page views.
Inspect each stage of the loading process, and see how the user interacted with the page. View error events or custom user timing markers.
Define custom alert thresholds for Core Web Vitals and other metrics. Get notified by email, in Slack, or through Microsoft Teams.
Track JavaScript errors and see how they impact visitor experience.
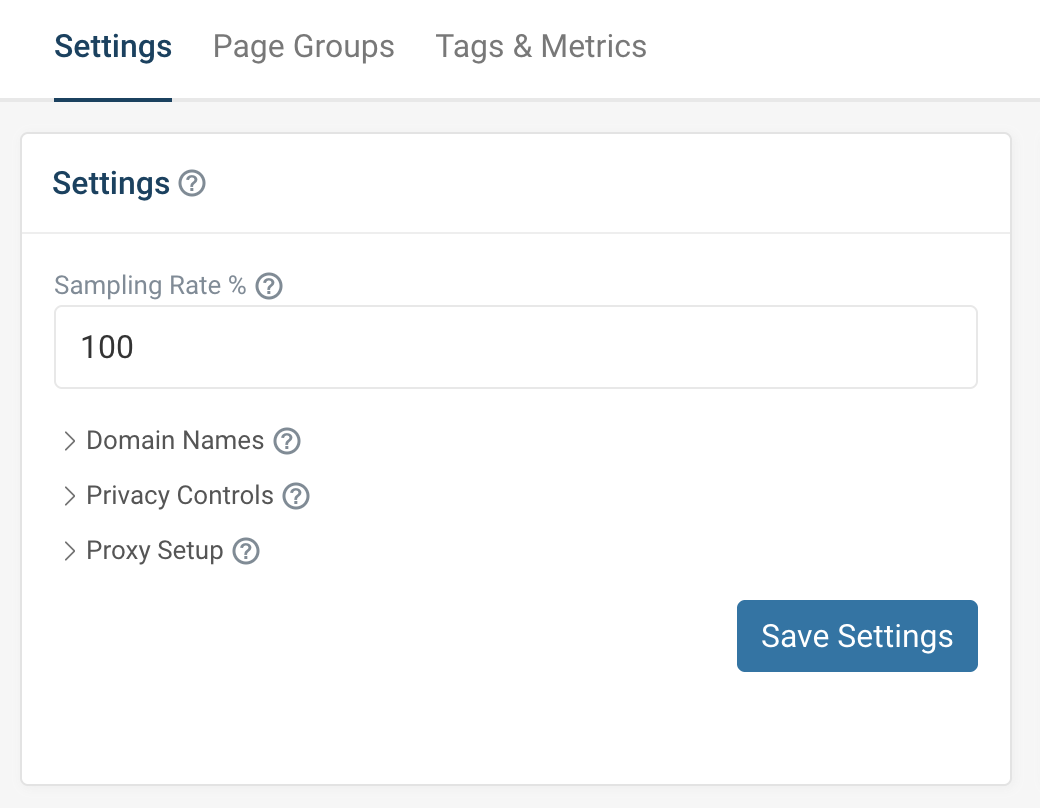
Track all visits to your website or only a certain percentage.
Get in-depth test reports, tailored recommendations, and test out optimizations without deploying code.
Stay on top of the data that impacts rankings. Benchmark against your competitors.
You are using an old browser that is not supported anymore. You can continue using the site, but some things might not work as expected.